A Panel Rating Becomes Useful When You Add Time and Place
A hypothetical 400-watt solar panel receiving the equivalent of five hours of full reference sunlight would produce 2 kilowatt-hours before operating losses are considered. That simple calculation is a useful starting point, but it is not a universal daily forecast. The same panel can deliver very different energy on a shaded winter roof and an exposed summer ground mount. To estimate electricity production sensibly, connect rated watts with the sunlight reaching the panel, its operating conditions, and the equipment carrying power to the home. Then look at monthly and annual results rather than expecting a flat daily allowance. The goal is a realistic energy range for a specific installation, with enough explanation to understand why an actual day may differ from the estimate.
A: That would treat weak and changing light as constant reference sunlight.
A: It expresses accumulated irradiation as five equivalent hours at the reference intensity.
A: No. The home may use some generated electricity before it reaches the utility meter.
A: They reveal seasonal differences hidden by a single yearly average.
A: It models representative conditions rather than an exact future weather sequence.
A: Their combined reference capacity is 8 kilowatts DC.
A: Yes. Clipping occurs when available array power exceeds its processing capacity.
A: No. Check whether the chosen tool already models it separately.
A: It needs context about weather, timing, measurements, and any alerts.
A: Keep the layout, equipment list, commissioning results, and original production forecast.
Distinguish Instantaneous Power From Accumulated Energy
Watts describe how quickly electrical energy is being produced at a particular moment. Kilowatt-hours describe how much energy is produced over an interval. A 400-watt panel operating at exactly that power for one hour would generate 400 watt-hours, or 0.4 kilowatt-hours. In reality, output rises and falls, so daily energy is the sum of production across many changing moments rather than the nameplate rating multiplied by every daylight hour.
This distinction explains why a monitoring display can look disappointing at one instant while the day still produces useful energy. Morning sunlight may be weak, a cloud may briefly cross the array, or the module may face away from the strongest light at that hour. Review the accumulated daily total alongside the power curve. One indicates the day’s harvest, while the other helps explain when the electricity arrived and which conditions shaped it.
Use Peak Sun Hours as an Energy Shortcut
Peak sun hours express a day’s solar irradiation as an equivalent duration at 1,000 watts per square meter. They are not the same as hours between sunrise and sunset. A long day can include weak early and late light, and a cloudy day can spread a modest solar resource over many hours. The shortcut translates changing sunlight into a quantity that can be multiplied by rated array capacity for an initial estimate.
For example, 0.4 kilowatts multiplied by five equivalent sun hours gives 2 kilowatt-hours before losses. If an illustrative combined adjustment retained 80 percent, the result would be 1.6 kilowatt-hours. Both the sunlight value and the adjustment are hypothetical here. A real project needs local resource data, the proposed orientation, temperature effects, shading, and other relevant losses rather than a convenient number borrowed from another region.
Do not stack adjustments without checking what they include. A production tool may already model temperature and inverter conversion separately, while a simple rule of thumb may combine several effects. Applying the same loss again would understate production. Write down whether each factor belongs to incoming sunlight, module operation, or the downstream electrical system. That small discipline makes an estimate easier to check and prevents a plausible-looking calculation from hiding duplicated assumptions.
Location Sets the Available Solar Resource
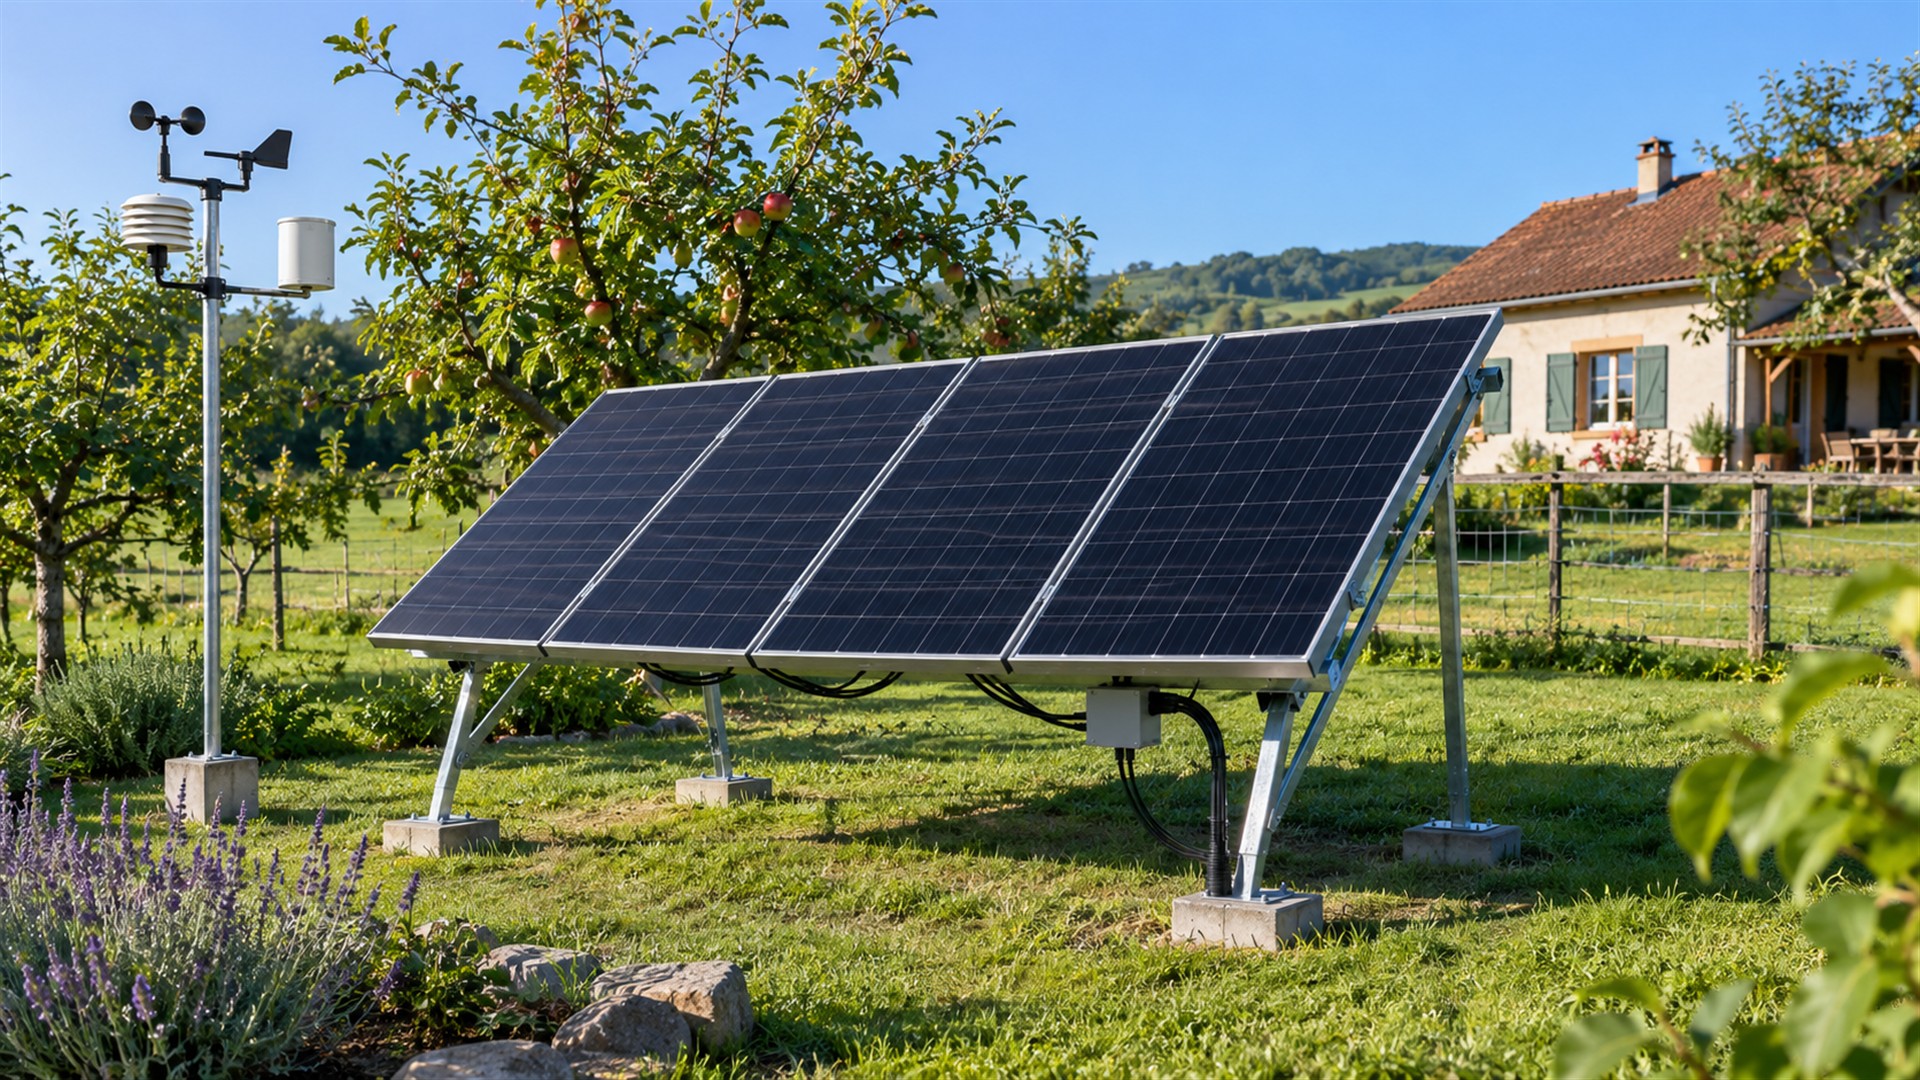
Solar resource varies with latitude, regional climate, season, and the orientation of the receiving surface. A national average cannot represent every roof. For a first site estimate, use a location-based production calculator with appropriate weather data and realistic installation inputs. The PVWatts help documentation explains that its grid-connected production estimate uses a year of hourly simulation. Treat such a result as modeled performance, then refine the inputs as the roof survey and equipment design become available.
Orientation and Tilt Shape When Energy Arrives
A panel receives different sunlight depending on the direction it faces and its slope. A surface favoring morning sun produces a different daily pattern from one favoring afternoon sun. The annual total also changes, although the best arrangement for a property can depend on available roof planes and the owner’s objectives. A high annual total and a useful afternoon contribution are related goals, but they are not always identical.
Compare the actual proposed planes rather than assuming every module shares one ideal orientation. A split array across two roof faces should be modeled accordingly. Roof geometry, surrounding obstacles, and installation requirements may constrain tilt or direction. Ask which design is being estimated and what alternatives were considered. A forecast based on an ideal south-facing surface is not an adequate explanation for panels ultimately placed on different slopes.
Shade Requires a Seasonal View
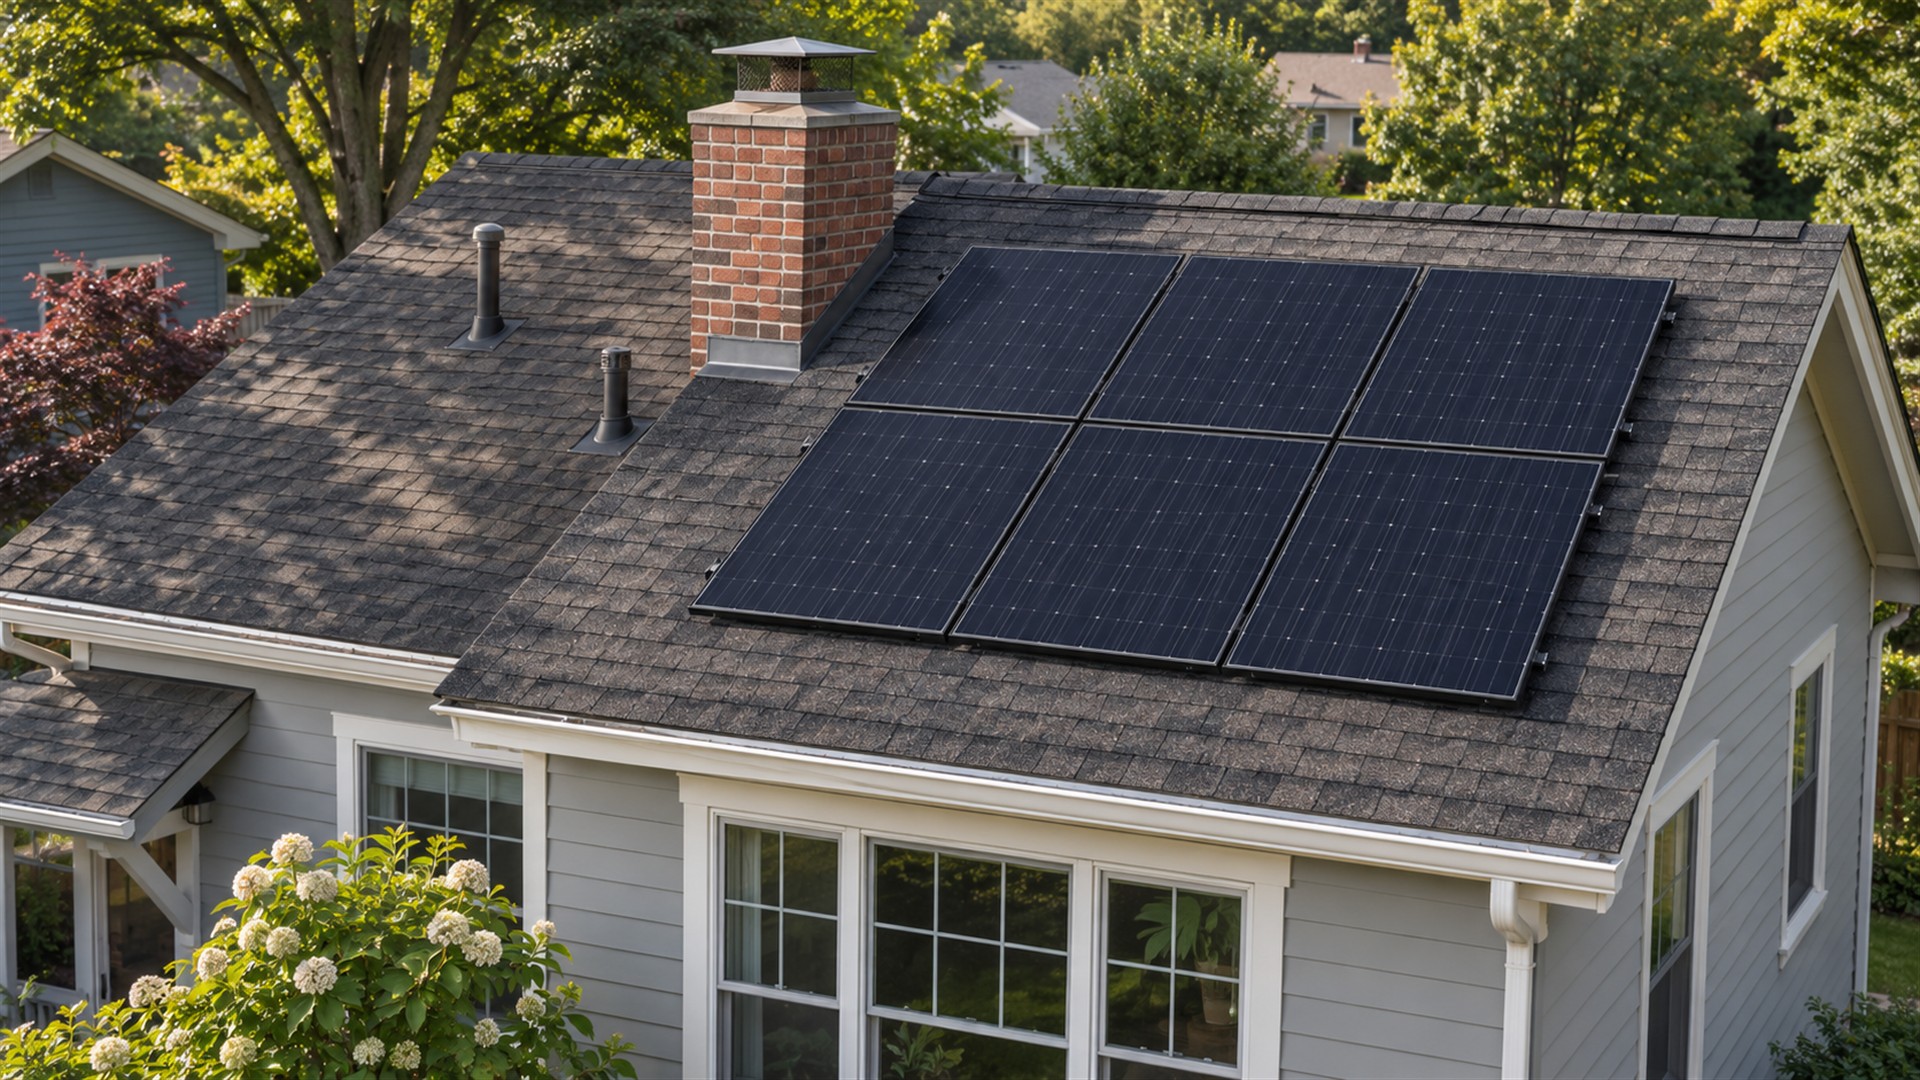
Trees, chimneys, neighboring buildings, and roof features can reduce useful sunlight. Their shadows move with the sun and change through the year. A roof that appears clear at noon in summer may have limited winter exposure. Effective assessment therefore examines more than a single photograph or the general brightness of the neighborhood. The relevant question is how much sunlight reaches each proposed part of the array during the hours that contribute energy.
Electrical layout influences how partial shade affects output. Modules connected in a string interact, and module-level electronics may change how individual operating conditions are managed. No electronics can replace sunlight that never reaches a shaded module, however. Ask for the production estimate with the actual shade assessment included, rather than accepting a promise that a particular inverter type makes shading irrelevant. The design should explain the remaining losses clearly.
Future changes matter as well. Tree growth, a planned addition, or new neighboring construction can alter exposure after installation. Some uncertainties cannot be eliminated, but they can be identified. Keep the shade survey and original assumptions with the system records so that a later decline can be investigated against a meaningful baseline. This is especially helpful when equipment appears normal and the change comes from the surrounding property.
Temperature Modifies the Nameplate Expectation
Reference wattage is measured under defined conditions, including a specified cell temperature. Operating cells can become considerably warmer than the outdoor air, and most silicon modules lose power as cell temperature rises. Wind, mounting clearance, sunlight, and the roof environment affect that response. A hot bright afternoon may therefore produce less instantaneous power than the same incoming sunlight would produce with cooler cells. A location-based model should account for temperature instead of treating the label as a constant outdoor output.
The Inverter and Wiring Affect Delivered Electricity
A rooftop module produces direct current, while most household circuits use alternating current. The inverter performs the conversion and has its own operating characteristics. Wiring, connections, module mismatch, and other system effects can also influence delivered energy. When reading a forecast, establish whether the stated production is DC energy at the array or AC energy available after conversion. Comparing figures from different points in the system can create a false performance gap.
Inverter clipping occurs when potential array power temporarily exceeds the inverter’s processing capacity. Some designs accept occasional clipping as part of a reasonable annual tradeoff. The lost energy depends on how often and for how long the condition occurs, not simply on the difference between two equipment ratings. Review the annual model and the proposed sizing rationale rather than judging the installation from one flattened midday power curve.
Monthly Totals Explain the Annual Figure
Dividing annual production by 365 produces an average day that may rarely occur. Winter and summer differ in daylight, solar angle, weather, and sometimes snow coverage or seasonal shading. Request monthly estimates so that the annual number has a visible shape. Those estimates help explain why a system that performs well over a year can still import substantial electricity during particular seasons.
Weather also varies from year to year. A typical-year model is not a prediction of the exact sequence of clouds, storms, and temperatures in the coming year. The PVWatts results guidance distinguishes representative modeled production from the electricity a system generates in a particular year. Use that distinction when comparing actual output with the forecast and avoid treating every deviation as proof of an equipment defect.
A useful proposal should state the expected production period and what uncertainty remains. If a performance commitment is offered, read its separate terms, measurement method, exclusions, and remedy. A modeled annual estimate and a contractual guarantee are different claims. Keeping them distinct makes later performance discussions more constructive because both parties can identify the evidence and obligations relevant to the concern.
Scale a Panel Estimate Into a System Estimate Carefully
Multiplying a per-panel estimate by panel count can work for a uniform arrangement, but it can mislead when modules face different directions or experience different shade. Begin with the total rated capacity and the real layout. Where necessary, evaluate separate roof planes or subarrays. The resulting system estimate should reflect the arrangement actually being installed, including the selected inverter and the practical limits at the grid connection.
For an illustrative twenty-panel array using 400-watt modules, total reference capacity is 8 kilowatts DC. That arithmetic does not establish its annual energy or the household demand it can cover. Local sunlight, system operation, and consumption patterns still need consideration. A homeowner can use the capacity figure to compare scope while relying on the site model to estimate energy. Each number then serves a clear purpose rather than carrying claims it cannot support.
Read Monitoring at the Correct Boundary
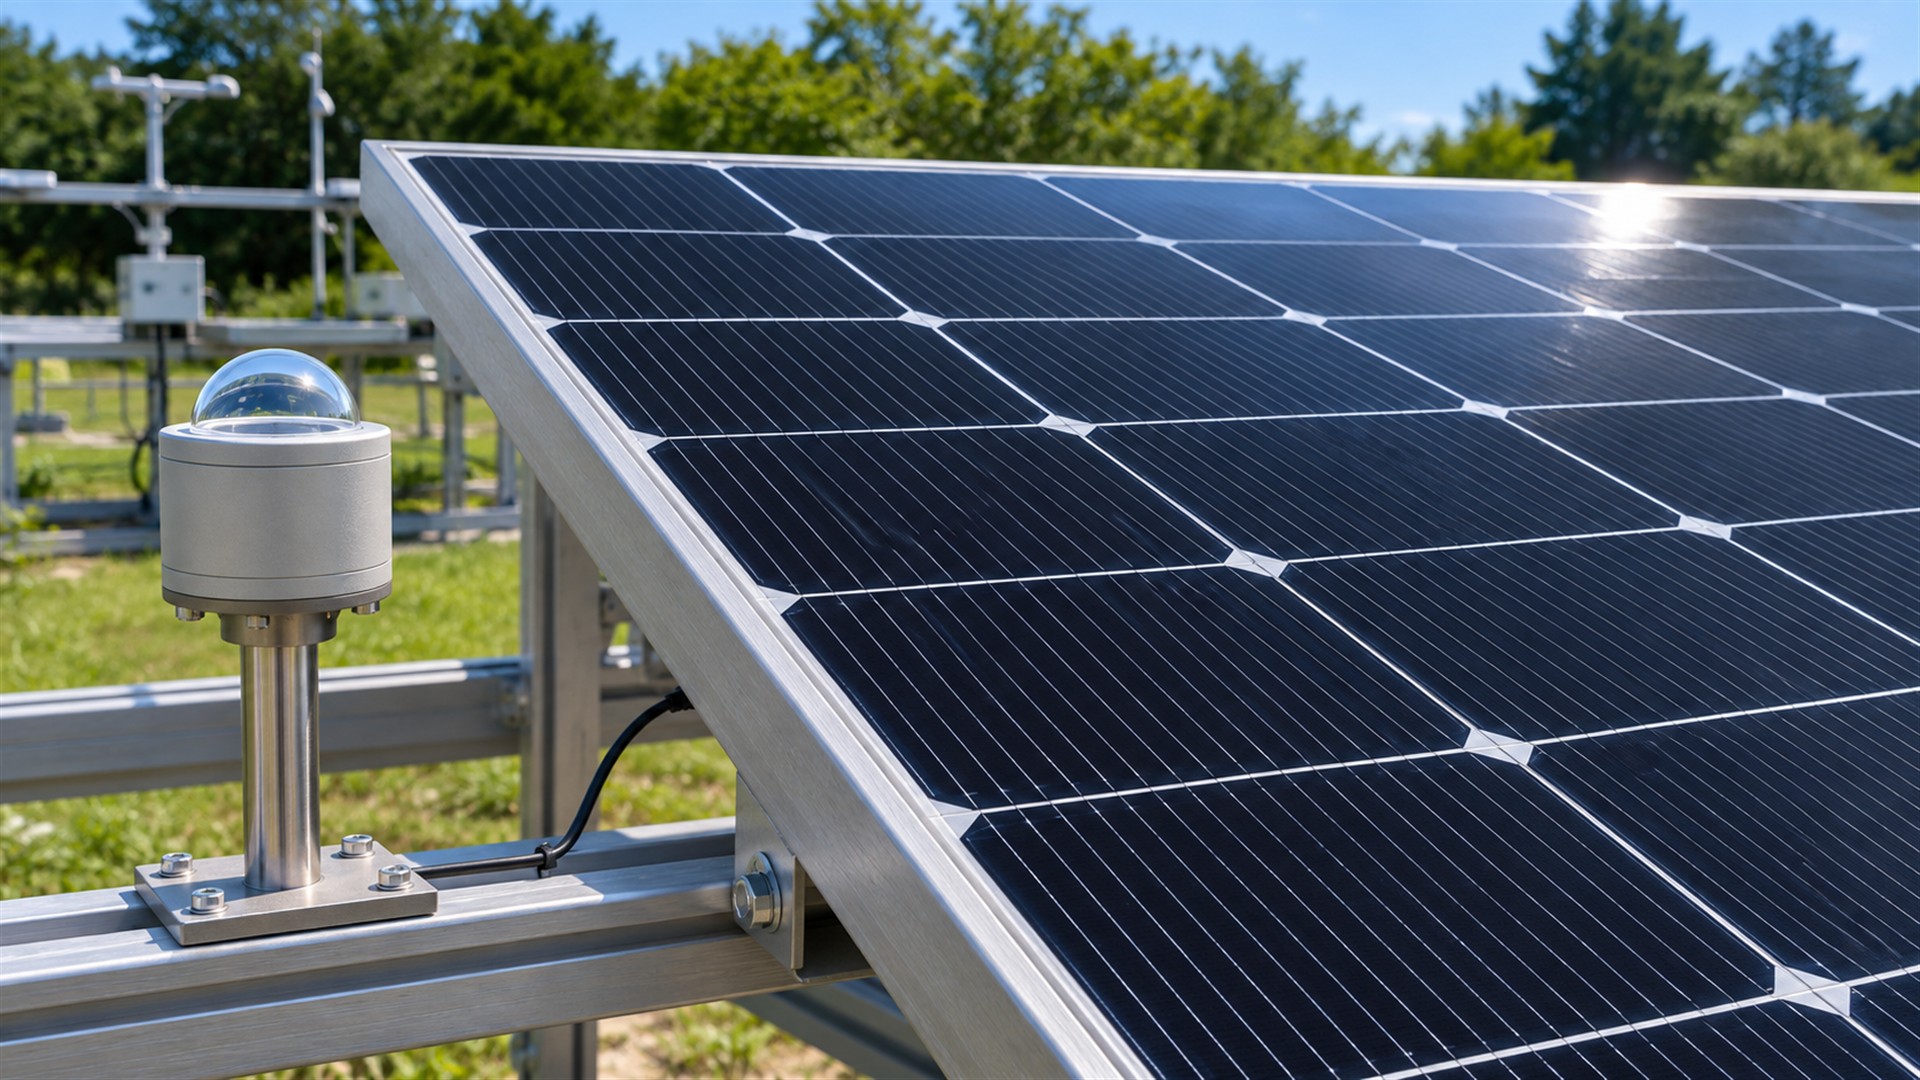
Generation monitoring, an inverter display, and the utility meter may report different quantities. A home can consume solar electricity before it reaches the utility connection, so exported energy can be much lower than total production. Some dashboards also estimate consumption using sensors that require correct installation and configuration. Before interpreting a reading, identify what is measured, where it is measured, and which interval the value covers. This avoids confusing low export with low generation.
Investigate Changes With Comparable Evidence
Compare like periods and conditions when reviewing output. A cloudy November day should not be judged against a clear June peak. Look for persistent changes, missing monitoring data, fault alerts, and differences between comparable parts of the array. If an unexpected decline remains after weather and obvious shading are considered, a qualified service provider can investigate the equipment and measurements. A screenshot of one low reading is a starting observation rather than a diagnosis.
Keep the original layout, equipment list, commissioning results, and production estimate available. These records let a technician determine whether the installation has changed and where a measurement belongs. They also help distinguish a module issue from an inverter, communications, or sensor problem. An understandable baseline makes troubleshooting more efficient and reduces the temptation to replace components before identifying the cause.
For planning, the strongest answer to how much electricity a panel produces is therefore a documented estimate for a particular site and period. Start with watts and local sunlight, account for the complete system, and inspect the seasonal pattern. Then compare actual generation using appropriate measurements and context. This gives the owner a useful expectation that can guide decisions without turning a convenient average into a daily promise.
Keep the Forecast Version With the Quote
Save the assumptions used when each offer was prepared. A revised layout, different module quantity, or changed inverter can alter production after the first estimate is issued. Ask for the final forecast to match the final equipment and drawing. That makes later comparisons traceable and prevents a preliminary number from becoming the reference for a different installation.